the Creative Commons Attribution 4.0 License.
the Creative Commons Attribution 4.0 License.
 | 28 May 2020
A pyroelectric thermal sensor for automated ice nucleation detection
Fred Cook
Rachel Lord
Gary Sitbon
Adam Stephens
Alison Rust
Walther Schwarzacher
A new approach to automating droplet freezing assays is demonstrated by comparing the ice-nucleating efficiency of a K-feldspar glass and a crystal with the same bulk composition. The method uses a pyroelectric polymer PVDF (polyvinylidene fluoride) as a thermal sensor. PVDF is highly sensitive, cheap, and readily available in a variety of sizes. As a droplet freezes latent heat is released, which is detected by the sensor. Each event is correlated with the temperature at which it occurred. The sensor has been used to detect microlitre volume droplets of water freezing, from which frozen proportion curves and nucleation rates can be quickly and automatically calculated. Our method shows glassy K-feldspar to be a poor nucleator compared to the crystalline form.
- Article
(2736 KB) -
Supplement
(223 KB) - BibTeX
- EndNote


Ice nucleation is of great importance, particularly to atmospheric science, whereby the presence of ice-nucleating particles (INPs) can drastically change the temperature at which supercooled droplets of water freeze. This in turn has a large impact on the lifetime, precipitation, and other important properties of clouds (Murray et al., 2012; Hoose and Möhler, 2012). Accurate cloud modelling faces several barriers, since atmospheric processes and the interactions of droplets within clouds are complex, e.g. the Bergeron–Findeisen process (Pruppacher and Klett, 1997), and capturing them with available computing power is not a straightforward task. However, more fundamentally, the kinetics behind the different modes of heterogeneous ice nucleation (immersion, deposition, condensation, and contact) on INPs are not well understood.
It is assumed that each INP has preferential areas for ice nucleation at active sites, the exact arrangement and nucleating ability of which are unique to any individual INP (Holden et al., 2019). Direct investigation into the formation of ice at these active sites is difficult due to the stochastic nature of nucleation and the small size (nanometre scale) of the initial ice nucleus. Although computational modelling provides insight into the favoured structures of water molecules as they freeze on surfaces, there are still many limitations, mostly due to the timescale problem (Sosso et al., 2016). At all but the lowest temperatures spontaneous nucleation events are very rare. To capture them in simulations requires a compromise between the accuracy of the water molecule model, the number of water molecules in the system, and total simulation time. Coarse-grained water models can simulate on the order of 106 molecules for around 1 ms (English and Tse, 2015), more detailed models reduce the number of molecules to 105 on a similar timescale, and ab initio calculations are currently limited to around 100 molecules. These numbers may be compared to a picolitre of water, at the smaller end of the experimental scale, which contains on the order of 1013 molecules and can remain liquid for hours even at very low temperatures. One way to reduce the time necessary is by careful seeding of molecules into ice-like structures; however, this can lead to unpredictable biases in the results. Experimentally the timescale problem is not an issue, as experiments can last for days if necessary (Heneghan and Haymet, 2003) and larger volumes of water can be used to greatly increase the chance of a nucleation event being observed.
There are many experimental methods for determining nucleation rates, including levitators (Jing et al., 2019; Krämer et al., 1999; Lü and Wei, 2006), cloud chambers (Möhler et al., 2003), continuous flow diffusion chambers (CFDCs) (Rogers, 1988; Kanji and Abbatt, 2009; Hiranuma et al., 2015; Chou et al., 2011; Stetzer et al., 2008), and cold plate droplet arrays (Hiranuma et al., 2015; Häusler et al., 2018; Gibbs et al., 2015; Campbell et al., 2015; Whale et al., 2015; Tobo, 2016; Tarn et al., 2018), each able to probe different conditions for nucleation (Demott et al., 2018). For instance, CFDCs allow control of the vapour saturation over ice, enabling deposition- and immersion-mode nucleation to be investigated. However, assumptions have to be made about the mode of nucleation according to the relative humidity, with deposition mode or pore condensation mode (Marcolli, 2014) assumed below 100 % and immersion–condensation mode assumed above (Boose et al., 2019). Furthermore, there is an upper temperature limit, suggested by Hiranuma et al. (2015) to be −9 ∘C, beyond which the saturation conditions cannot be maintained, and there is also the issue of particle detection; e.g. Tobo et al. (2013) were unable to detect particles smaller than 0.5 µm. Cloud chambers are an attractive alternative for atmospheric scientists as they recreate the natural dynamics of cloud formation over a wide range of temperatures. However, they also suffer from problems with the detection of small particles, as well as particles settling out in the course of the experiment, leading to biases in the ice nucleation rates obtained (DeMott and Rogers, 1990). A problem common to both CFDCs and cloud chambers is that they can only probe small numbers of particles, which makes the evaluation of poor INPs difficult, as nucleation events are rare.
For studying immersion-mode ice nucleation, cold plate arrays are especially useful. A typical cold plate array is shown in Fig. 1. Most immersion-mode droplet array ice nucleation experiments use droplets on the order of picolitres to microlitres. In general this method involves pipetting an array of droplets onto a cold plate, although microfluidic generators (Tarn et al., 2018) and droplet printers (Peckhaus et al., 2016) are also used. The droplets are then cooled, usually with a linear decrease in temperature, although temperature steps are also used (Gibbs et al., 2015), with the freezing temperature of each droplet recorded. The frozen fraction is measured as a function of temperature, from which a nucleation rate can be calculated (Whale et al., 2017). By using a cold plate droplet array the effects of varying INP concentrations over several orders of magnitude can be investigated. As only one nucleation event is required to freeze a droplet, even the nucleating ability of poor INPs can be tested. Of course cold plate arrays also have drawbacks. For example, since the droplets sit on a substrate, it is essential to exclude substrate-induced nucleation. It also essential to control the purity of the water used to form the droplets as even traces of contaminant could affect the nucleation probability.
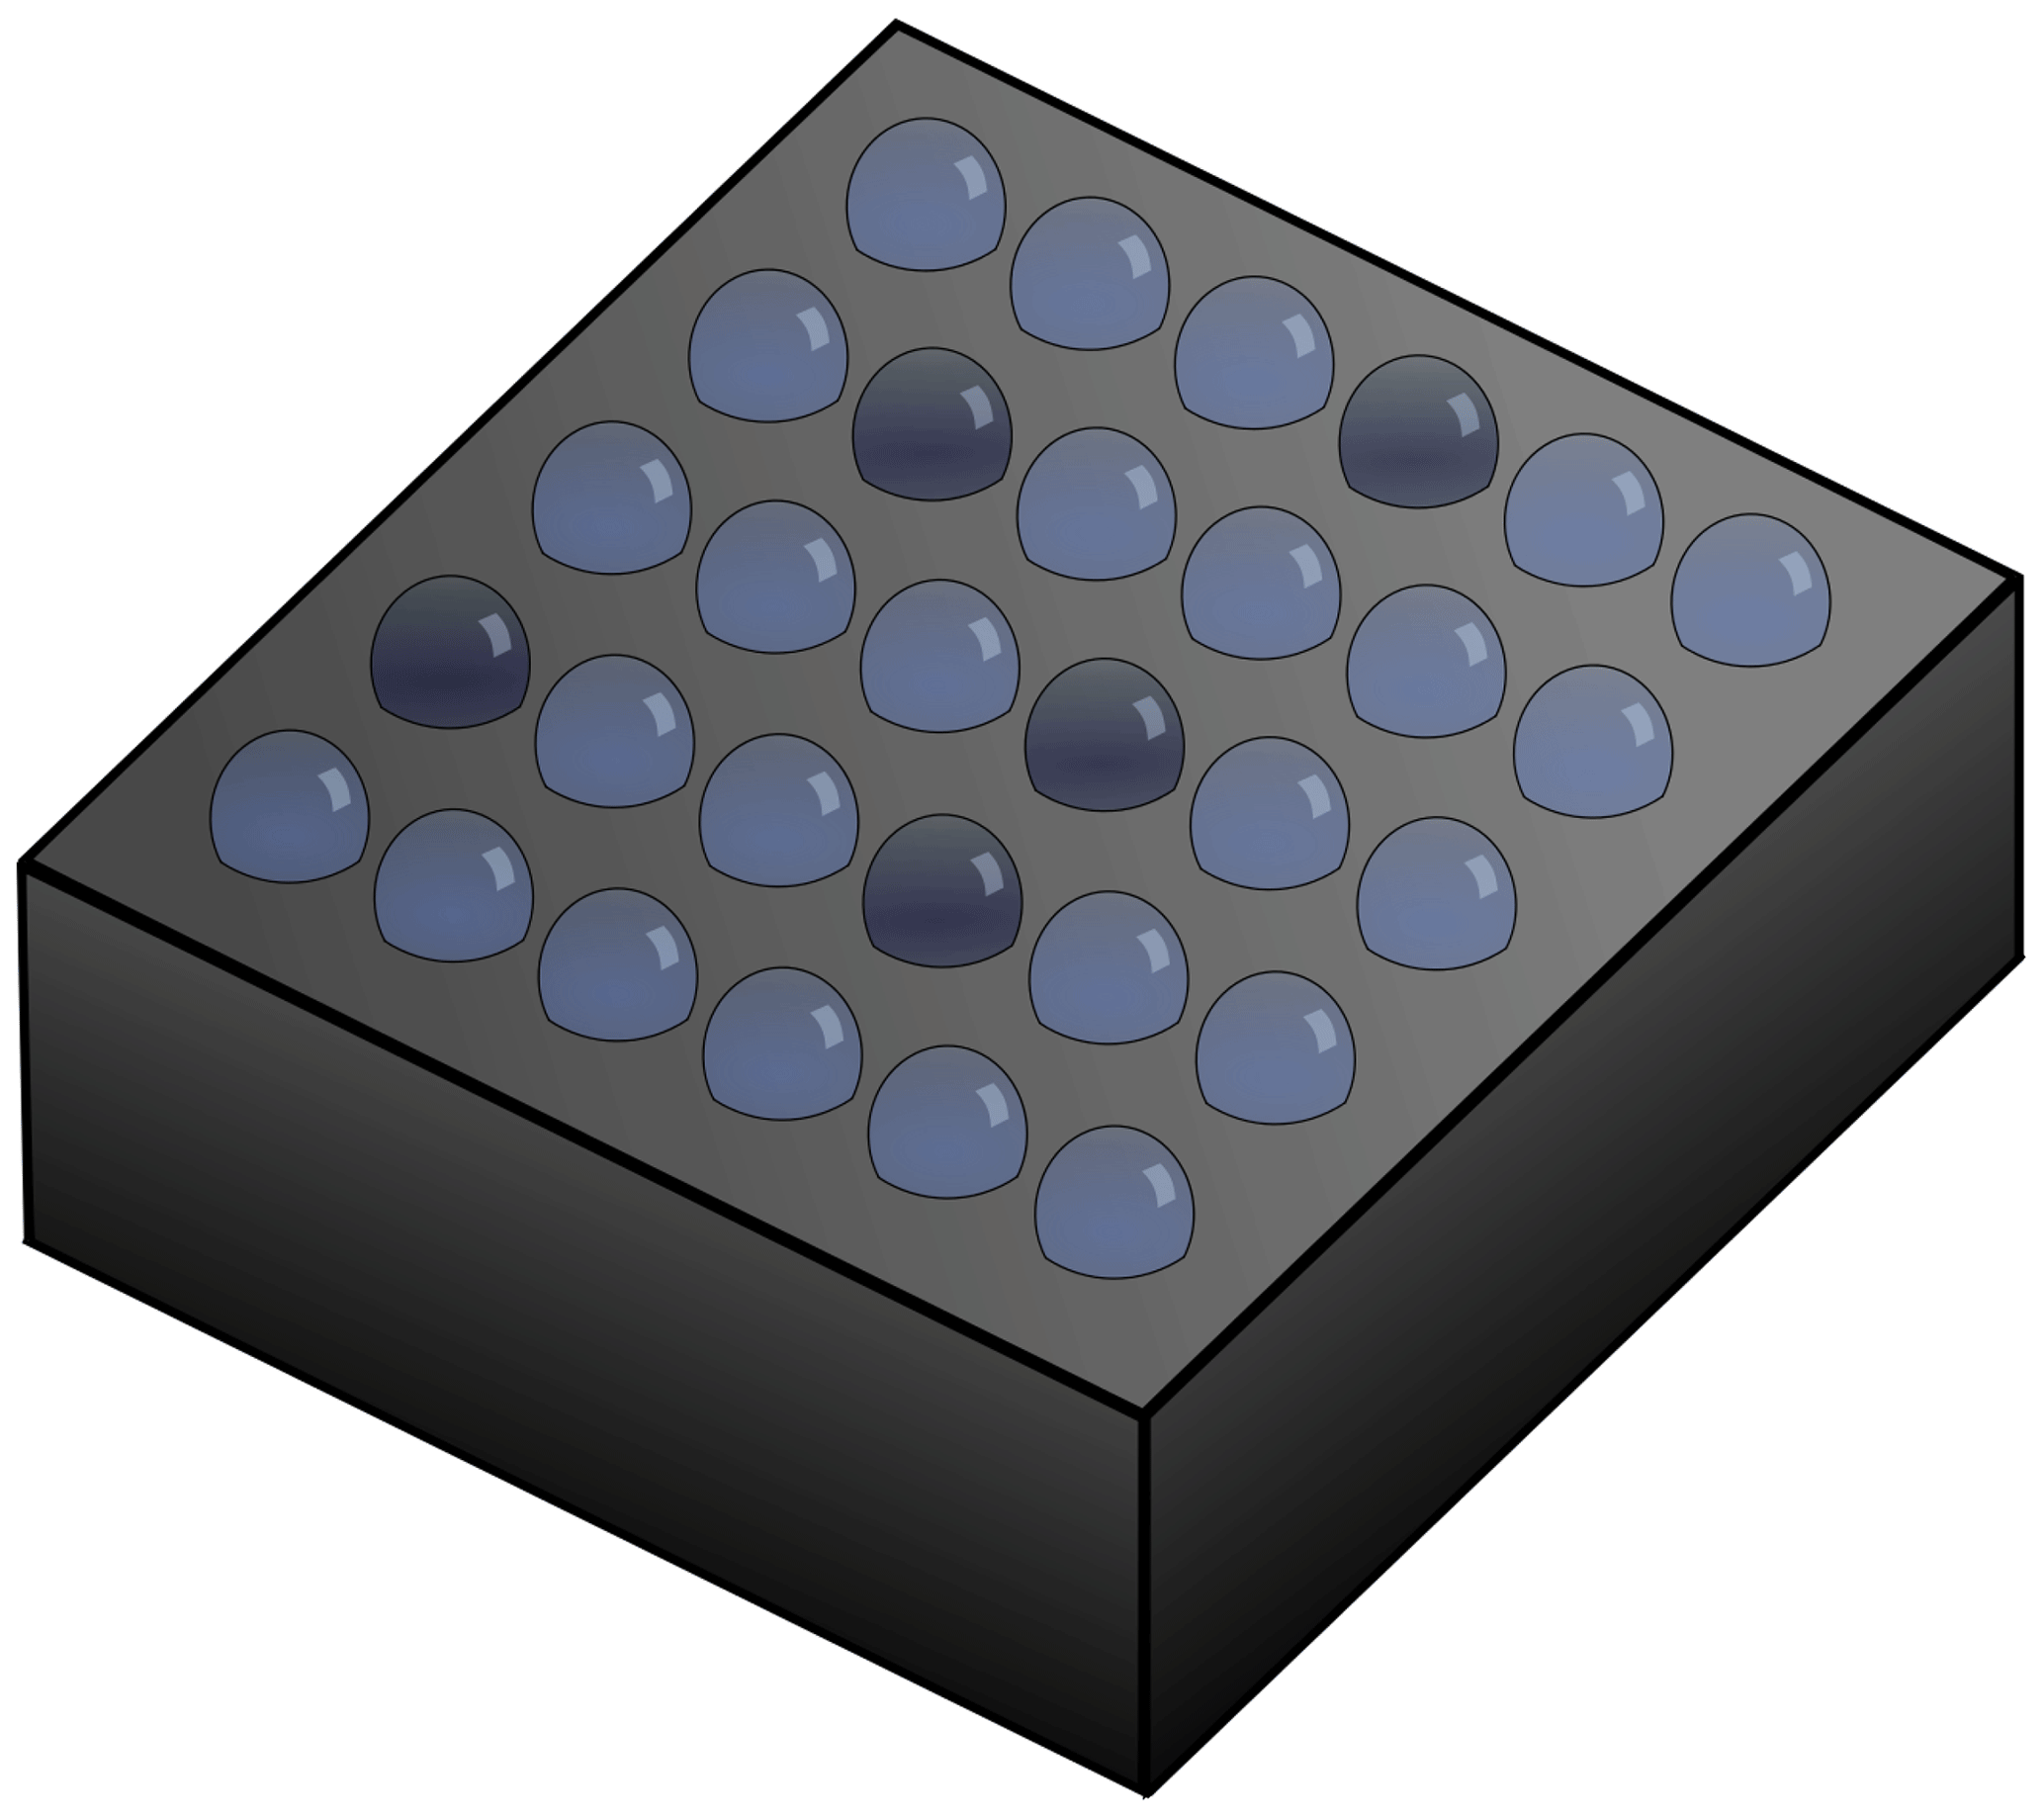
Figure 1Schematic of a typical cold plate array, with droplets arranged in a grid on a heat sink. The heat sink is typically cooled by liquid nitrogen or a Peltier device. The diagram shows some droplets frozen (dark).
Without automation, determining the temperature at which each droplet freezes is a time-consuming process, especially for the large number of droplets required to compensate for the stochastic nature of nucleation. Freezing events are usually detected via a change in the optical properties, such as a change in transparency, or via the latent heat released. Optical detection has been automated (Peckhaus et al., 2016; Budke and Koop, 2015; Stopelli et al., 2014; Reicher et al., 2018), with software to recognize the locations of droplets and monitor the associated pixel intensity, which goes through a sudden change at the point of freezing. This effect can be enhanced using polarizers to take advantage of the birefringence of ice (Peckhaus et al., 2016). However, automation is not completely straightforward, as it requires large amounts of data processing and storage to analyse images of the droplets, as well as ways to avoid artefacts leading to false identification of freezing events. For instance, droplets can move during cooling, which can lead to a change in measured pixel intensity unless each droplet is tracked, and movement in the lab can lead to shadows or reflections over the droplet, also causing a possible change in measured pixel intensity.
The latent heat of crystallization can be detected by monitoring the infrared emissions of droplets (Zaragotas et al., 2016; Harrison et al., 2018; Kunert et al., 2018) or via calorimetry. Differential scanning calorimetry (DSC) has been widely used (Riechers et al., 2013; Parody-Morreale et al., 1986; Yao et al., 2017; Kaufmann et al., 2017; Kumar et al., 2018) to study ice nucleation. However, DSC is not directly comparable to other methods discussed here as it cannot detect individual droplets freezing. Infrared thermometry (Harrison et al., 2018) has the advantage that it can also be used to measure the temperature of droplets as they freeze, revealing any thermal gradients across the set-up which may otherwise be neglected. However, due to the Stefan–Boltzmann law infrared thermometry at low temperatures is usually limited to large droplets, although the latent heat released by droplets as small as 0.1 µL freezing has been reported Kunert et al. (2018).
Latent heat can also be detected by other kinds of thermal sensors. Here we present a particularly simple, cheap, and adaptable pyroelectric-polymer-based device for this purpose. The pyroelectric polymer used is polyvinylidene fluoride (PVDF), which can be bought in large pre-metallized sheets and cut to shape. This adaptability means it can be incorporated into many standard droplet array experiments. The latent heat released by droplets provides a clear and unambiguous signal which can be easily converted to a list of droplet freezing temperatures for further analysis. We provide information on how our PVDF sensor was optimized and details of the associated charge-amplifying circuitry.
To demonstrate the effectiveness of our sensor, we present data comparing the nucleating ability of a standard sample of crystalline K-feldspar (BCS-CRM 376/1, as used by Atkinson et al., 2013) with a glassy sample having the same bulk chemical composition. K-feldspar has been shown to be an important contributor to the ice nucleation activity of mineral dust aerosol (Atkinson et al., 2013; Yakobi-Hancock et al., 2013) and has therefore been studied extensively (Kiselev et al., 2017; Whale et al., 2017; Zolles et al., 2015; Pedevilla et al., 2016; Peckhaus et al., 2016; Harrison et al., 2016; Augustin-Bauditz et al., 2014; Kumar et al., 2018). For example, Kiselev et al. (2017) showed that, at least in deposition mode, ice preferentially forms on the high-energy (100) surface, only exposed in cracks and defects, not on the most easily cleaved (001) surface as previously suggested (Pedevilla et al., 2016). Despite the insight this provides into the nature of active sites, there is no guarantee that the same applies to immersion-mode freezing. Indeed, recent molecular dynamic simulations by Soni and Patey (2019) of water molecules on clean (001), (010), and (100) surfaces of microcline K-feldspar show no evidence of ice nucleation, further suggesting the importance of defects in ice nucleation. In order to investigate the importance of the presence of crystalline surfaces at active sites a standard crystalline sample of K-feldspar is compared to a glassy sample of the same bulk composition.
Our glassy sample was made by melting, quenching, and grinding the crystalline sample. Quenching the sample means the long-range order of a crystalline structure is not given time to form, leading to an amorphous structure more similar to that of the liquid form. A similar approach was recently used by Maters et al. (2019) in comparing natural crystalline samples and their glassy equivalents. The difference in local structure alone could lead to the glassy and crystalline samples having very different ice nucleation behaviours. However, it is also necessary to consider their different mechanical properties (Debenedetti, 1996). Crystals can be cleaved along preferred surfaces, often resulting in flat faces, although there will also be a number of defects present. Glasses do not have long-range order, leading to irregular shapes when they are mechanically ground, with very different surface structure to the crystalline form. Surface topography has been shown to be extremely important in determining ice-nucleating efficiency (Holden et al., 2019; Whale et al., 2017). In addition, the interaction of water and INPs is complex, and the chemical nature of bonds at the surface as well as the structure play an important and interconnected role. Even if crystalline and glassy samples have the same bulk chemical composition, their surface chemistries could differ.
The difference in ice-nucleating efficiency between crystalline and glassy samples is of considerable practical importance, as material glassy samples are not just of interest for their different structural properties. Particles dispersed by volcanic eruptions include a mixture of glassy and crystalline aluminosilicates, with the proportions of components varying widely between eruptions (Wright et al., 2012; Cashman and Rust, 2016). The ice-nucleating ability of particles within the plume is of great interest since the prevalence and effectiveness of INPs within a plume will have a large effect on their lifetime and dynamics, knowledge of which is vital for accurate forecasting (Macedonio et al., 2016).
A pyroelectric material has a temperature-dependent spontaneous electric polarization (Whatmore, 1986). As the temperature of the pyroelectric element changes the spontaneous polarization also changes, causing a build-up of charge at the surface. Unlike the thermoelectric effect, a temperature gradient is not required, just an absolute temperature change. If the surfaces are metallized the pyroelectric element can be thought of as a parallel plate capacitor which is charged by changes in temperature.
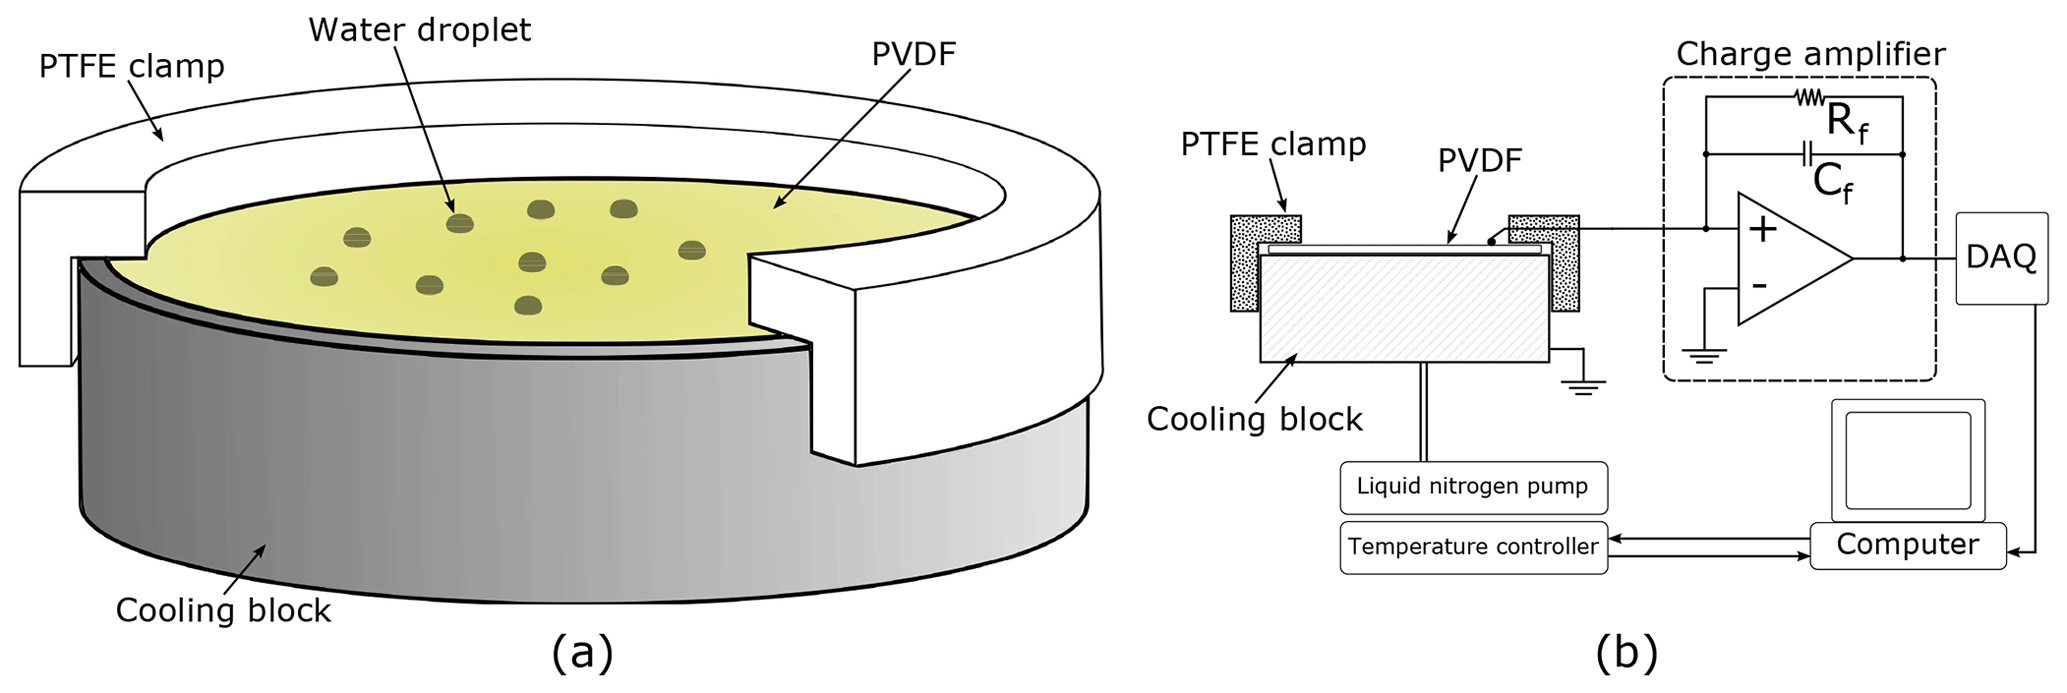
Figure 2(a) A cutaway diagram of the cooling block with the PVDF and clamp in place. The wire used to make contact with the upper surface is not shown. (b) A schematic of the experimental set-up including a simplified circuit diagram of the charge amplifier.
Not all PVDF is pyroelectric; it must be mechanically stretched in the presence of a strong electric field to induce a spontaneous net dipole moment. The PVDF used here was purchased from Piezotech, pre-stretched and metallized with approximately 200 nm of gold on top of 50 nm of chromium on both sides. Three different thicknesses, 9, 52, and 110 µm, were purchased. The as-delivered 10 cm×10 cm sheets were cut to shape, in our case circles 20 mm in diameter to sit on the silver cooling block of a Linkam THMS600 cooling stage, shown in Fig. 2a. When cutting it is easy to crimp the two surfaces together accidentally, electrically shorting the two sides, meaning that no charge will be measured. Such short circuits can be detected by testing for continuity with a multimeter.
In use the PVDF is held against the cooling block using a custom machined plastic (PTFE) clamp. This grips the edge of the cooling block and is pushed down to exert a small amount of pressure on the PVDF to keep it flat, as well as to hold a wire in contact with the upper surface. Contact with the lower electrode is made via the cooling block, which is grounded. Before an experiment, the top gold surface supporting the droplet array is coated with Vaseline to make it hydrophobic (Tobo, 2016).
When using pyroelectric materials both the thermal and electrical properties of the system must be considered. Since the response from the PVDF depends on the absolute temperature change, a thermally isolated pyroelectric element with as small a thermal mass as possible will give the greatest signal for any given input. However, the requirement for thermal isolation conflicts with the requirement for excellent thermal conductivity to keep the droplets in thermal equilibrium with the cooling block. In practice even the thickest PVDF has sufficient thermal conductivity to maintain equilibrium with the cooling block at a cooling rate of 1 ∘C min−1 and a low enough thermal mass that the temperature rise associated with the latent heat released by the freezing of a single microlitre droplet can be detected reproducibly.
The thickness of the PVDF also dictates its capacitance, which will have an effect on the electrical circuit used to detect the voltage change resulting from any temperature change. We constructed a charge amplifier using an LT1793 low-noise operational amplifier, in conjunction with a feedback capacitor, Cf, and feedback resistor, Rf, as shown in Fig. 2b. In the absence of the feedback resistor the feedback capacitor would be saturated by the charge that the PVDF releases as the temperature of the stage is lowered, even before any droplets froze. Using the feedback resistor there is a small negative offset to the signal output from the charge amplifier proportional to the cooling rate. When a droplet freezes the temperature of the PVDF increases rapidly and transiently due to the latent heat released. The pyroelectric effect produces a charge on the metallized surfaces of the PVDF that charges Cf and therefore gives rise to a positive spike in the output signal. The spikes decay exponentially with the characteristic electrical time constant of the circuit (≈20 ms). The output from the charge amplifier was monitored using an analogue-to-digital converter (NI USB-6002) sampled at 1 kHz, which is fast enough to detect all droplets freezing without creating unnecessarily large data files. For INPs that freeze over a very narrow temperature range, the sampling rate for this analogue-to-digital converter could be increased to 50 kHz to reduce the chance of near-simultaneous freezes not being detected as separate events. Data acquisition was controlled collected by a LabVIEW program, which also controlled the temperature of the cooling stage. The LabVIEW program returned an array with three columns; time, cooling block temperature, and sensor output signal.
Figure 3 shows a comparison of the voltage responses of the three different thicknesses of PVDF available when microlitre droplets of pure water freeze. The root mean square (RMS) noise values were computed for each thickness between 0 and −5 ∘C, before any droplets had frozen. These were 0.096, 0.1, and 0.104 V for the 9, 52, and 110 µm samples, respectively. The small increase in noise with thickness is due to the fact that all pyroelectric materials are also piezoelectric. Any mechanical vibrations, for instance due to liquid nitrogen being pumped through the stage, will produce a signal proportional to the amount of piezoelectric material present. Other than this, the noise value for each foil thickness is equivalent to within a few percent, consisting of a slow random oscillation superimposed with a 50 Hz oscillation due to mains interference, despite shielding of both the PVDF element and charge-amplifying circuitry. Figure 3 shows that the average peak height is inversely related to the thickness of the PVDF used. The average peak-height-to-RMS noise ratios are 5.1±0.6, 2.3±0.4, and 1.4±0.2 for the 9, 52, and 110 µm samples, respectively. All of these values were found using a 57 pF feedback capacitor in parallel with a 10 MΩ feedback resistor. The low thermal mass of the thinnest sample of PVDF leads to the highest absolute temperature change from the latent heat released and therefore the largest signal.
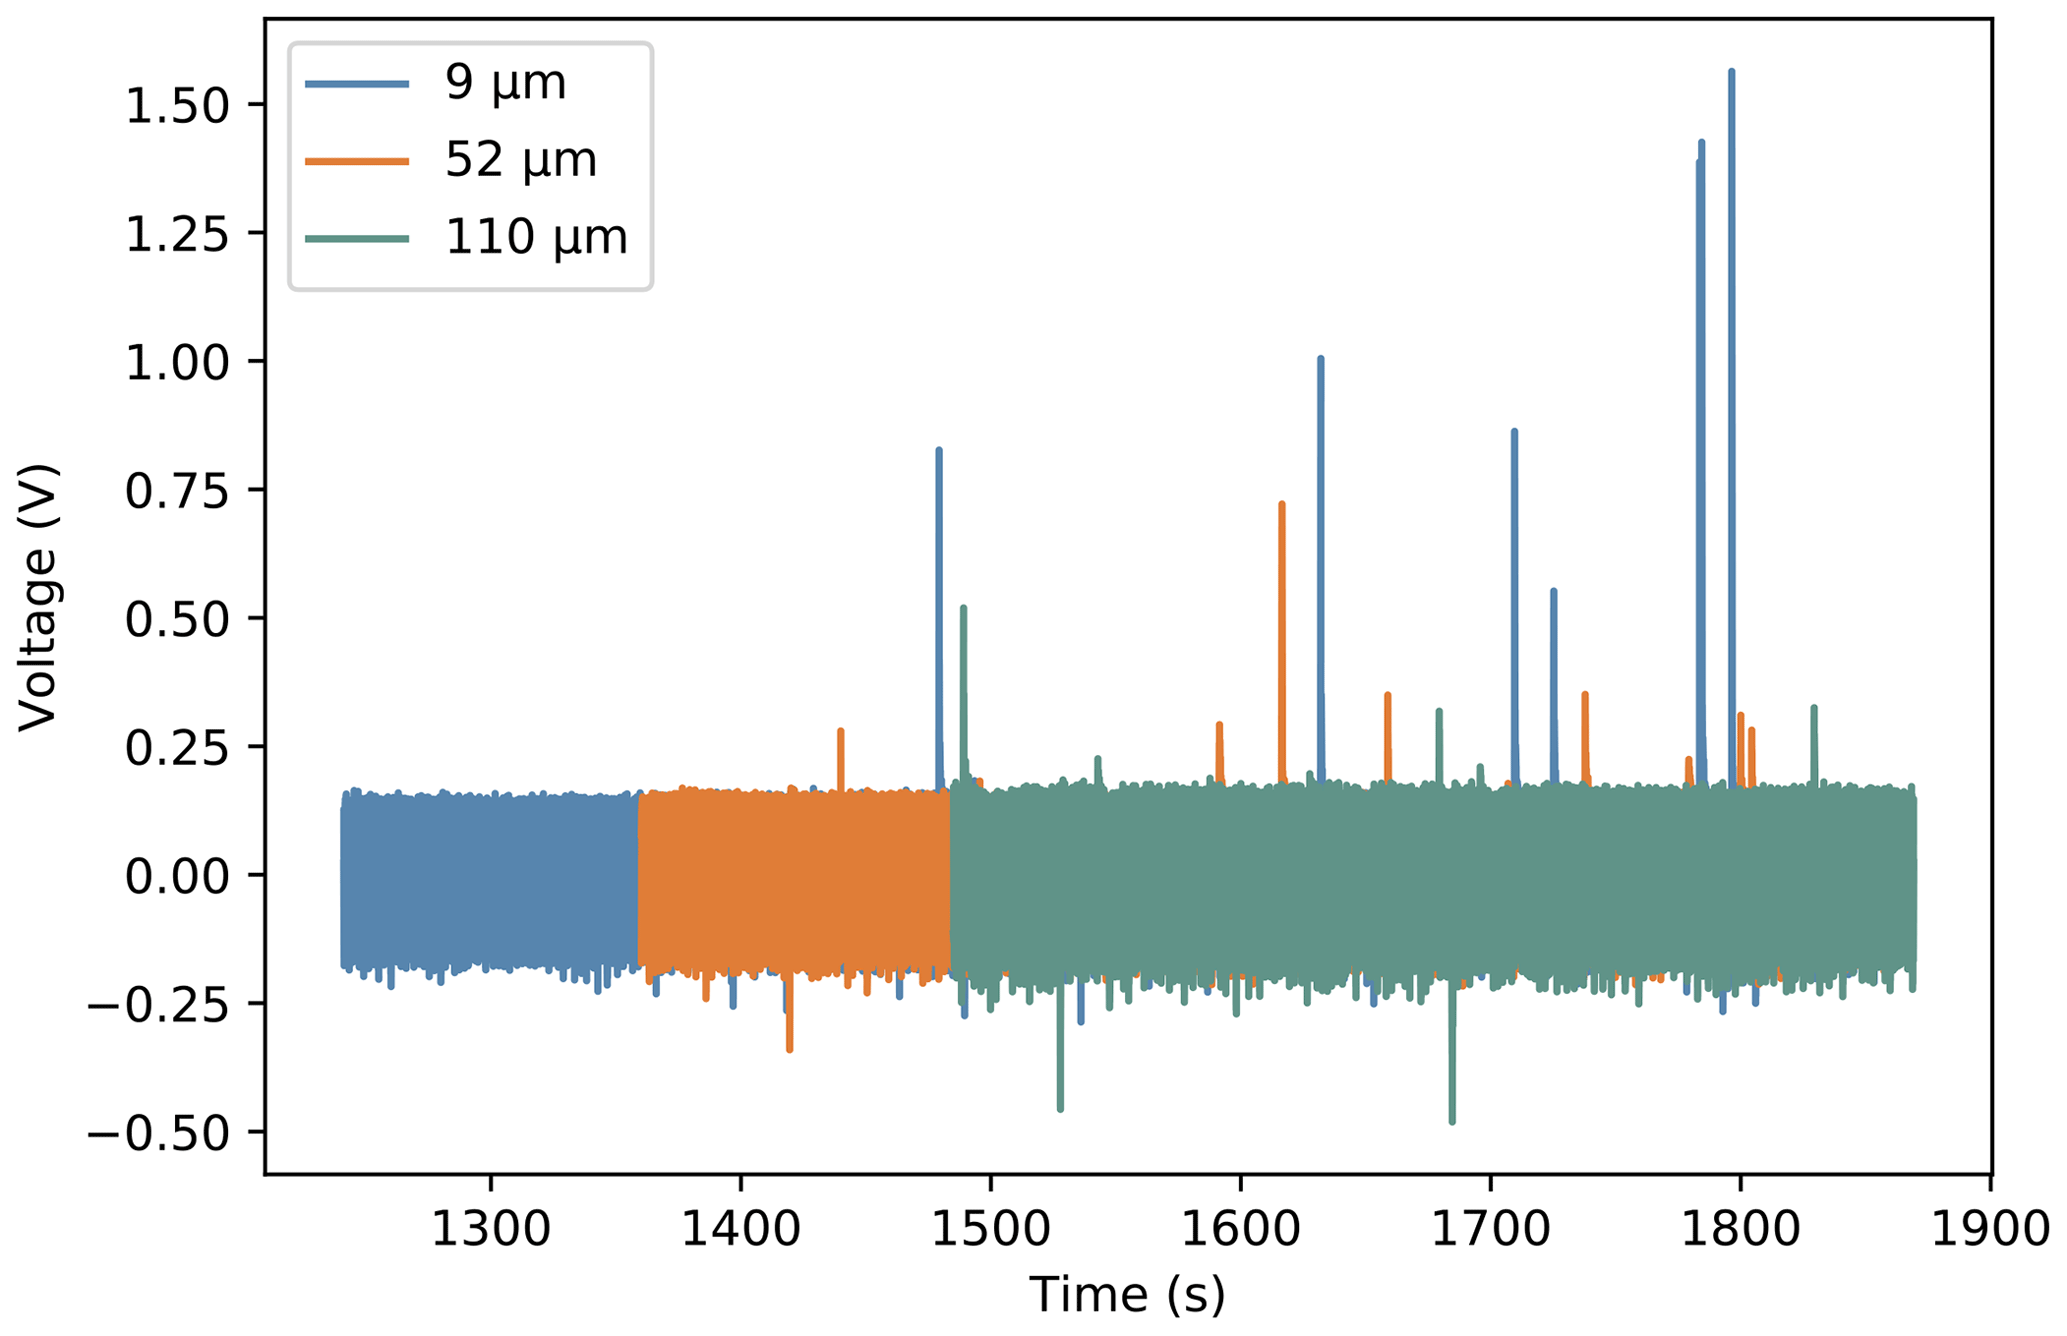
Figure 3Sections of voltage time graphs for three different thicknesses of PVDF overlaid on top of each other. Each positive spike represents the freezing of a microlitre droplet of pure water. The offset at the start shows the similar noise amplitude for each thickness.
In principle, the area under the peak corresponding to a droplet freezing is proportional to the latent heat released, and PVDF foils have previously been used as calorimeters (Etzel et al., 2010; Lew et al., 2010; Coufal and Hefferle, 1985). However, this is not possible in the present experimental arrangement for two reasons. Firstly, the situation is complicated by the continuously decreasing temperature of the cooling block, requiring the feedback resistor. Secondly, PVDF has large variations in pyroelectric constant across the surface (Lang and Das-Gupta, 1984) because during the poling process the PVDF is typically stretched up to 4 times its original length, leading to macroscopic crystalline and amorphous regions. Hence, there is large spatial variation in the pyroelectric response. The variation in the pyroelectric response means that the output signal for the same release of latent heat also varies. This can be seen in Fig. 3, where the spike heights have considerable variation for each thickness despite the droplets being nominally the same size (errors are discussed in the “Results and discussion” section). Hence, the voltage data cannot be used to quantify the energy released by a droplet freezing, only to show that a freezing event occurred. An alternative pyroelectric material is lithium tantalate (LiTaO3), as used by Frittmann et al. (2015). As it is a single crystal the spontaneous polarization is much more uniform spatially; however, this also makes it much more fragile and less adaptable to experimental set-ups than PVDF. Spatial variation in the pyroelectric coefficient also means that droplets smaller than 1 µL could be detected in places. However, in order to guarantee detection across the whole surface the minimum size was set at 1 µL. The minimum droplet size detectable is also dependent on the minimum supercooling: assuming the droplet temperature returns to 0 ∘C before freezing completely, the lower the supercooling, the lower the absolute temperature change on freezing and hence the lower the voltage pulse detected by the pyroelectric foil.
Sample preparation
The crystalline K-feldspar comes from the Bureau of Analysed Samples (BCS-CRM no. 376/1), as used by Atkinson et al. (2013). The crystalline sample was crushed in a ball mill with agate balls before being sieved using a fine mesh (aperture size 20 µm).
The glassy K-feldspar sample was made from the crystalline sample melted in a platinum crucible. It was held at 1250 ∘C overnight to remove moisture, before being heated to 1600 ∘C for 2 h. After this, the sample was removed from the furnace and allowed to quench in air. A few sections of the glass formed were examined under a polarizing microscope, and no birefringent regions were observed. The glassy sample was then crushed and sieved using the same method described for the crystalline sample.
A range of mass fraction suspensions was prepared for each sample using Milli-Q 18.2 MΩ water. All experiments were completed within a week of the suspensions being made. Before pipetting onto the cold stage each sample was ultrasonicated for 15 min to break up aggregates. Samples were kept in sealed glass tubes which were previously cleaned by filling the vials with nitric and sulfuric acid for 30 min each, before thorough rinsing with Milli-Q 18.2 MΩ water. They were stored out of direct light.
Feldspar materials are susceptible to surface changes in aqueous solutions (Lee and Parsons, 1995) and when exposed to extreme pH (Kumar et al., 2018), which could lead to a change in their ice-nucleating ability. Peckhaus et al. (2016) measured a 2 ∘C decrease in freezing temperatures of K-feldspar stored in aqueous solution for 5 months. However, Kumar et al. (2018) recorded no change in the ice-nucleating ability of crystalline K-feldspar after 1 week in water suspension, and Harrison et al. (2016) noted no significant changes in the freezing temperatures of crystalline K-feldspar due to time spent in water suspension. We assume that any ageing of K-feldspar in aqueous solution is sufficiently slow to not have an effect on our results. Due to the identical chemical composition of the glassy sample we assume that any ageing effects are similarly slow.
The surface area of both samples was measured via Brunauer–Emmett–Teller (BET) nitrogen gas absorption. Three repeats were taken, with the mean to extreme range used as the error. The values were 5.0±0.7 and 1.8±0.4 m2 g−1 for crystalline and glassy K-feldspar, respectively, which are comparable to other experiments. The percentage errors associated with the surface area per unit mass dominate the error in calculating surface area present in each droplet. There are also errors associated with the masses of K-feldspar and water when making suspensions, the volume of each droplet pipetted, and the amount of material which settled out of suspension during pipetting (Tarn et al., 2018). These are particularly important for small droplet volumes and low concentrations (Knopf et al., 2020; Beydoun et al., 2016); however, due to the relatively large droplet volumes used here they are insignificant compared to surface area per mass error.
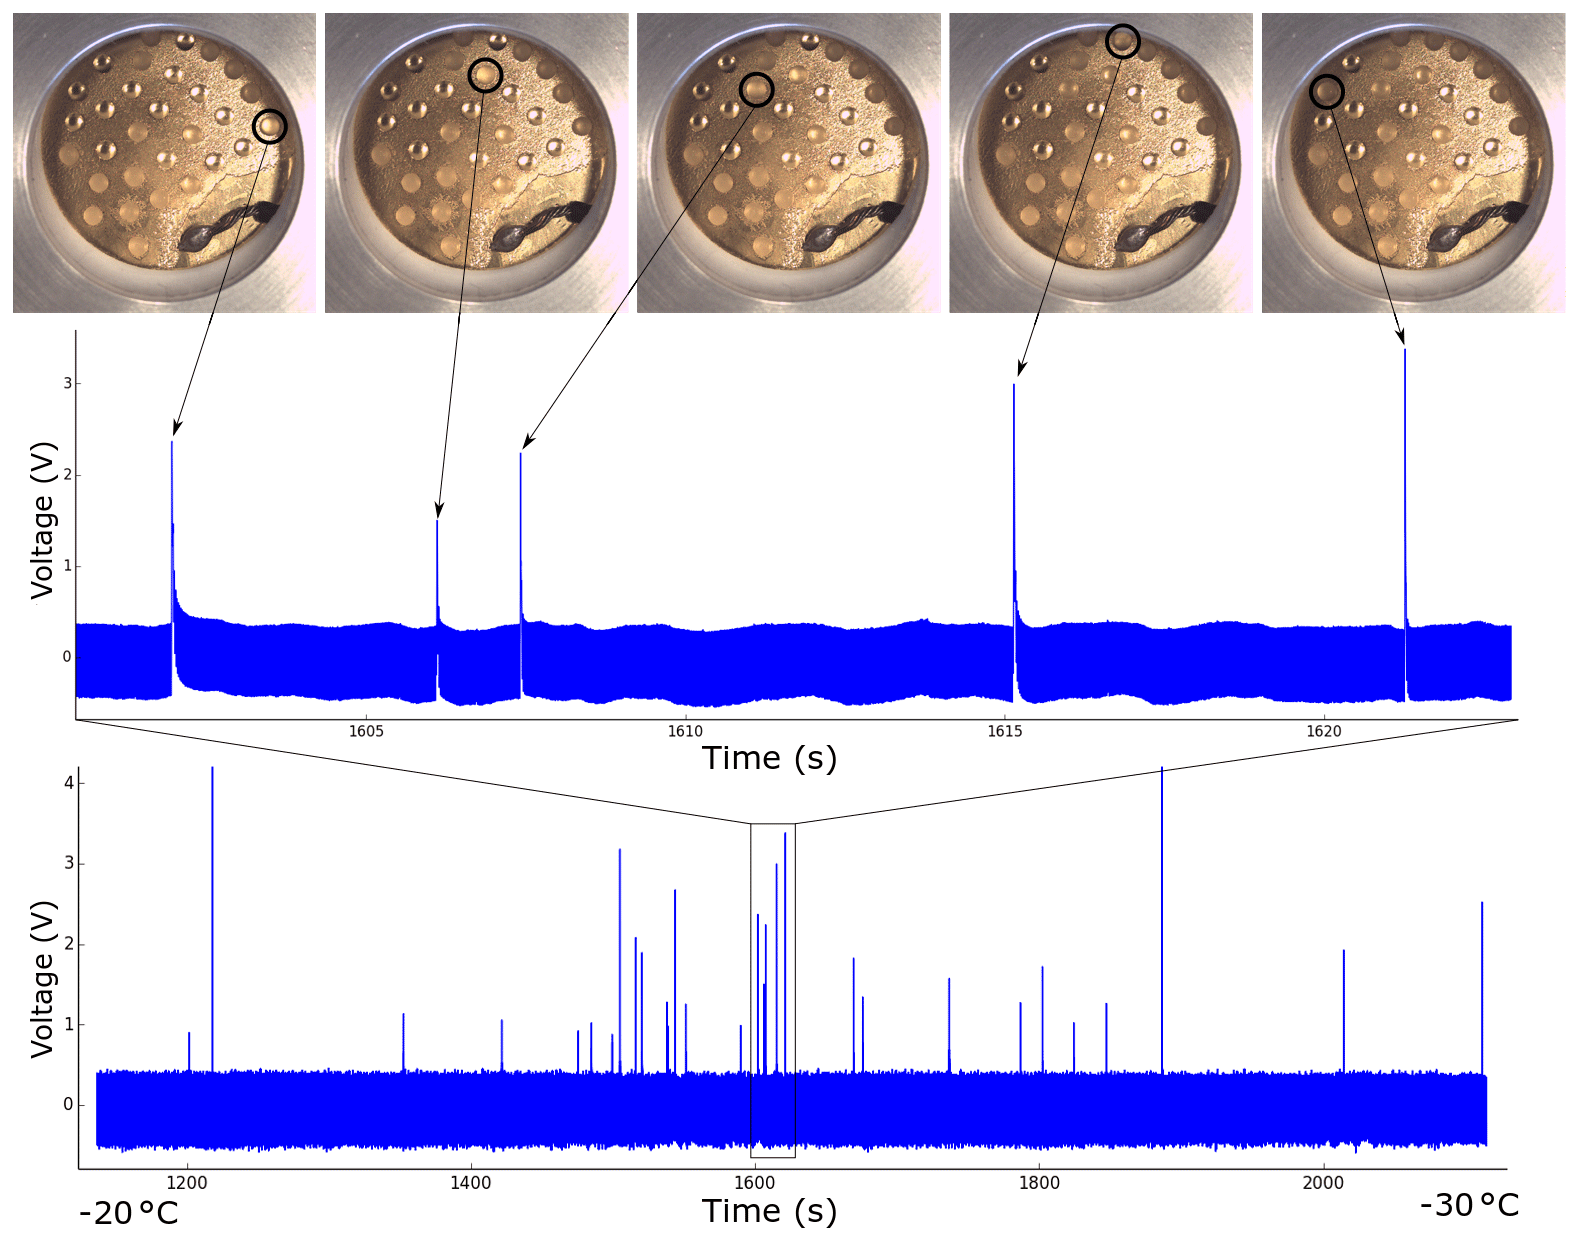
Figure 4Raw data from a typical experimental run, in this case pure water droplets measured to determine the background freezing rate of the instrument. Each spike represents a droplet freezing, as shown in the upper graph and corresponding pictures. Approximate temperatures corresponding to the start and end of the run are shown at the bottom.
A typical voltage time graph is shown in Fig. 4. The difference in peak height despite all of the droplets being the same size to the precision of the pipette (±0.03 µL) is visible for the reasons discussed in Sect. 2. Each assay of droplets produced a similar graph, which was converted to a list of freezing temperatures using a Python script. The thermocouple built into the liquid-nitrogen-cooled stage was used to measure the temperature, which was observed to oscillate by ±0.2 ∘C due to small fluctuations in the pumping rate. On top of this there was an unknown thermal lag due to the PVDF and the Vaseline on which the droplets were placed. This was estimated to be a maximum of approximately +0.8 ∘C based on literature values for the thermal conductivity of PVDF, leading to the asymmetric error shadings shown in Fig. 5a. The freezing of pure water (Milli-Q 18.2 MΩ) starts at higher temperatures than we would expect from the homogeneous parameterization by Atkinson et al. (2016). This was also noted by Whale et al. (2015) and attributed to the greater chance of contamination due to the large droplet size, although the source was unknown. As Tobo (2016) reached the homogeneous limit with microlitre droplets on Vaseline using a clean bench we assume that the source of the contamination is airborne (Polen et al., 2018).
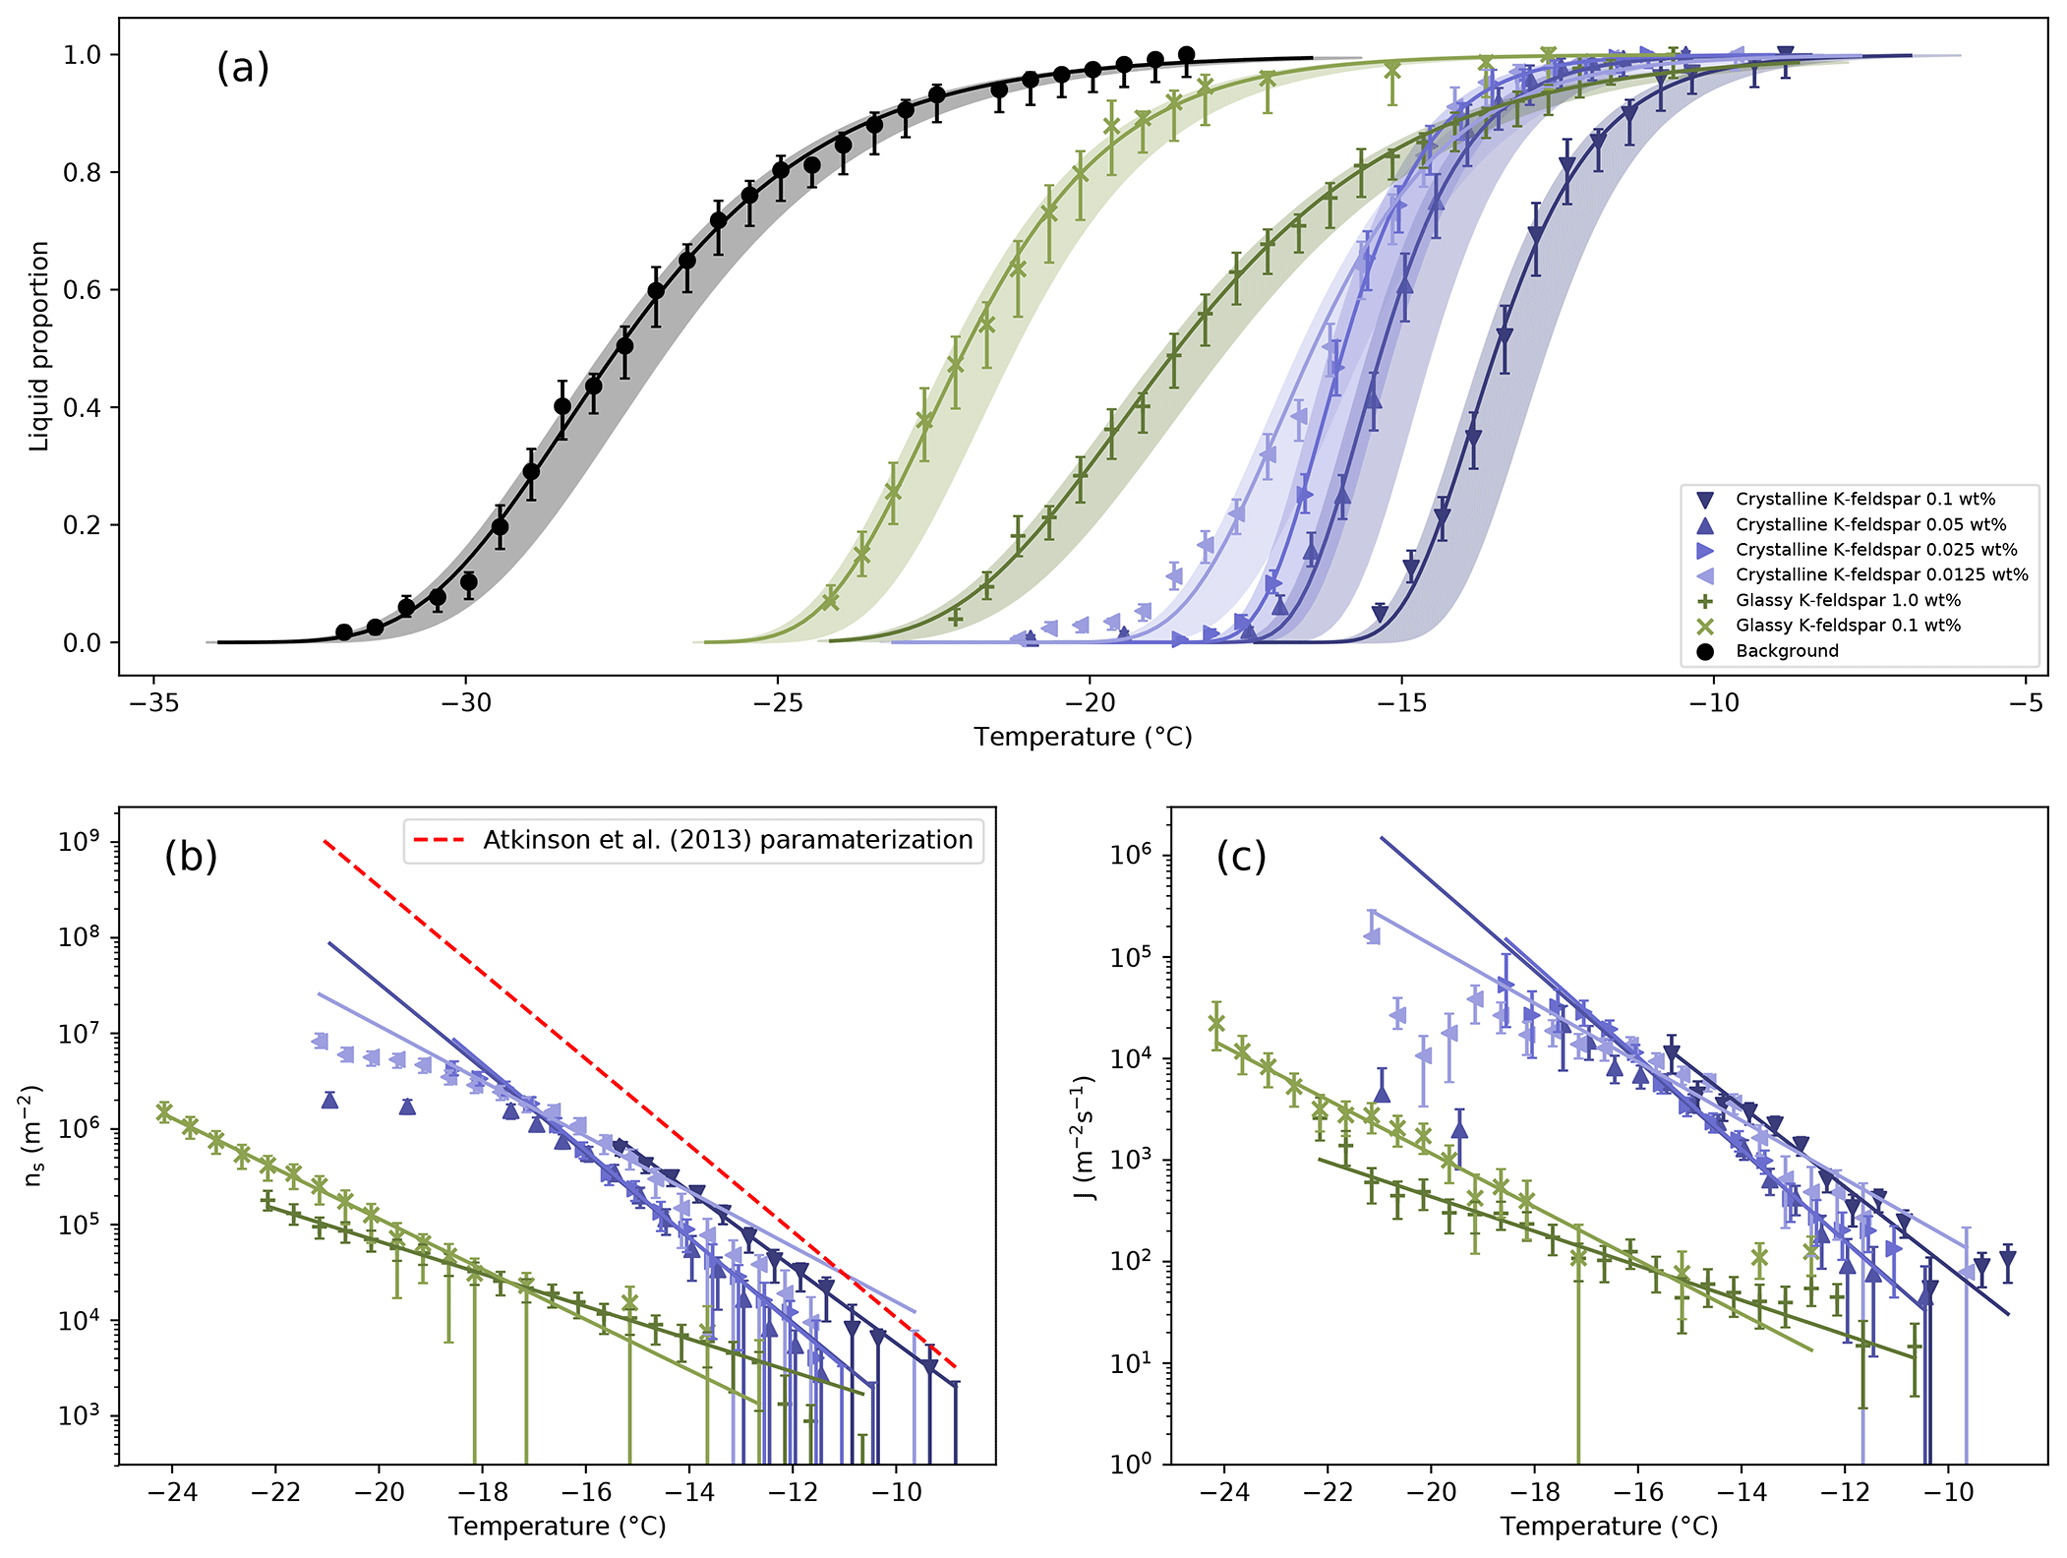
Figure 5(a) Liquid proportion curves for 1 µL droplets of water containing different fractions of glassy and crystalline K-feldspar. The background freezing rate of the instrument is also shown. Temperature errors are shown by the shading. Details on the lines of best fit can be found in the Supplement. (b) Ice nucleation active site density, normalized by the surface area present in each droplet. The red dashed line is the parameterization from Atkinson et al. (2013), which is partly based on microlitre-sized droplets with similar concentrations to those used here. (c) Freezing rates normalized by the surface area present in each droplet
Liquid proportion curves for the different mass fractions of glassy and crystalline K-feldspar studied are shown in Fig. 5a, along with the background freezing rate of the instrument. The influence of background freezing events on the liquid proportion curve of each experiment was calculated (more details in the Supplement), but in all cases the corrected curve lay within the temperature errors. The solid lines are taken from a fit assuming the liquid proportion curves follow a non-homogeneous Poisson process, referring to the fact that the rate constant is changing as a function of temperature. A full derivation of the fit can be found in the Supplement. From these curves the ice nucleation active site density, ns, and the heterogeneous nucleation rate, jhet, were calculated. Equation (1) (Connolly et al., 2009) was used to determine ns:
where n(T) is the number of liquid droplets out of a total population N at temperature T, and s is the surface area of INPs per droplet. Values for ns for each concentration are shown in Fig. 5b.
The results can also be interpreted in terms of a heterogeneous nucleation coefficient, jhet, normalized by the surface area of INPs present. A population of n liquid droplets containing an INP surface area s per droplet will freeze over time as shown in Eq. (2),
By applying the chain rule Eq. (3) is obtained,
where dT∕dt is a constant cooling rate, ∘C s−1, for all experiments here. The individual data points in Fig. 5c are from a numerical differentiation of the liquid proportion curves in Fig. 5a using a second-order central difference method. The lines are from an analytical differentiation of the fits to the liquid proportion curves (see the Supplement).
The calculation of jhet from liquid proportion data is least reliable at the lowest temperatures. At lower temperatures there are few liquid droplets remaining, leading to a breakdown in the approximation that Eqs. (1) and (3) is based on, that Δn∕n remains small (Koop et al., 1997). Also, as the temperature falls the probability that there would be multiple nucleation events in a single droplet increases (Atkinson et al., 2016). These factors lead to greatly increased errors in the nucleation rate calculated at low temperatures. There is also an effect from the fact that our droplets are not perfectly uniform due to variations in the amount of nucleant present and the effectiveness of nucleant in any given droplet. The value of jhet(T) found for glassy and crystalline K-feldspar here represents the freezing rate (Vali, 2014) divided by the surface area measured by BET. As discussed by Kubota (Kubota, 2019) those droplets which are below the average jhet are more likely to survive to lower temperatures, leading to a reduction in the measured nucleation rate.
Although the 1 wt % suspensions of glassy K-feldspar showed some nucleating ability at higher temperatures, the gradient of the liquid proportion curve remained much shallower than the crystalline form. While the nucleation active site density for crystalline K-feldspar was similar to that measured by Whale et al. (2015) using microlitre volume droplets, the active site density of glassy K-feldspar is approximately 2 orders of magnitude less at −20 ∘C. The heterogeneous nucleation rates also show a clear separation between the glassy and crystalline phase. However, further experimentation is needed to determine whether the importance of the crystalline form derives from its atomic order, its surface chemistry, or its microstructure. For example, a crystal can have well-defined steps and terraces at the surface, which are absent in a glass. The greatly reduced nucleating ability suggests the importance of the presence of the crystalline form at whichever active sites are responsible for the nucleating effectiveness of K-feldspar.
We have shown that the pyroelectric thermal sensor is effective in gathering ice nucleation data. The sensor produces an unambiguous signal for each microlitre droplet freezing event. Once a freezing run is finished the collected data can be passed into a Python script to extract a list of freezing temperatures. The script only takes a few seconds to run, and the data do not require any pretreatment, greatly reducing the total time for experiments. The method is also easily adaptable to fit a wide range of cold plate arrays, allowing faster throughput for many experiments. Alternative pyroelectric materials such as lithium tantalate (LaTiO3) could deliver improved performance, including the ability to quantify the heat released on freezing, though at the cost of being more fragile. The effectiveness of the sensor has been demonstrated with an experiment comparing crystalline and glassy K-feldspar, with the results strongly suggesting the importance of crystalline structure in the nucleating ability of K-feldspar.
All data and code are available on request.
The supplement related to this article is available online at: https://doi.org/10.5194/amt-13-2785-2020-supplement.
WS and AR devised the project. FC and AS developed the thermal sensor. FC gathered the nucleation data and wrote the LabVIEW and Python code for analysis. RL performed the BET analysis. Samples were provided by AR. GS provided lab assistance. FC wrote the paper, with input from WS and AR.
The authors declare that they have no conflict of interest.
This research has been supported by the Leverhulme Trust (grant no. RPG-2014-180) and the EPSRC (grant no. GCRF Institutional Sponsorship).
This paper was edited by Murray Hamilton and reviewed by Russell Perkins and two anonymous referees.
Atkinson, J. D., Murray, B. J., Woodhouse, M. T., Whale, T. F., Baustian, K. J., Carslaw, K. S., Dobbie, S., O'sullivan, D., and Malkin, T. L.: The importance of feldspar for ice nucleation by mineral dust in mixed-phase clouds, Nature, 498, 355–358, https://doi.org/10.1038/nature12278, 2013. a, b, c, d
Atkinson, J. D., Murray, B. J., and O'Sullivan, D.: Rate of homogenous nucleation of ice in supercooled water, J. Phys. Chem. A, 120, 6513–6520, https://doi.org/10.1021/acs.jpca.6b03843, 2016. a, b
Augustin-Bauditz, S., Wex, H., Kanter, S., Ebert, M., Niedermeier, D., Stolz, F., Prager, A., and Stratmann, F.: The immersion mode ice nucleation behavior of mineral dusts: A comparison of different pure and surface modified dusts, Geophys. Res. Lett., 41, 7375–7382, https://doi.org/10.1002/2014GL061317, 2014. a
Beydoun, H., Polen, M., and Sullivan, R. C.: Effect of particle surface area on ice active site densities retrieved from droplet freezing spectra, Atmos. Chem. Phys., 16, 13359–13378, https://doi.org/10.5194/acp-16-13359-2016, 2016. a
Boose, Y., Baloh, P., Plötze, M., Ofner, J., Grothe, H., Sierau, B., Lohmann, U., and Kanji, Z. A.: Heterogeneous ice nucleation on dust particles sourced from nine deserts worldwide – Part 2: Deposition nucleation and condensation freezing, Atmos. Chem. Phys., 19, 1059–1076, https://doi.org/10.5194/acp-19-1059-2019, 2019. a
Budke, C. and Koop, T.: BINARY: an optical freezing array for assessing temperature and time dependence of heterogeneous ice nucleation, Atmos. Meas. Tech., 8, 689–703, https://doi.org/10.5194/amt-8-689-2015, 2015. a
Campbell, J. M., Meldrum, F. C., and Christenson, H. K.: Is Ice Nucleation from Supercooled Water Insensitive to Surface Roughness?, J. Phys. Chem. C, 119, 1164–1169, https://doi.org/10.1021/jp5113729, 2015. a
Cashman, K. and Rust, A.: Volcanic Ash: Generation and Spatial Variations, in: Volcanic Ash, edited by: Mackie, S., Cashman, K., Ricketts, H., Rust, A., and Watson, M., 2, 5–22, Elsevier, https://doi.org/10.1016/B978-0-08-100405-0.00002-1, 2016. a
Chou, C., Stetzer, O., Weingartner, E., Jurányi, Z., Kanji, Z. A., and Lohmann, U.: Ice nuclei properties within a Saharan dust event at the Jungfraujoch in the Swiss Alps, Atmos. Chem. Phys., 11, 4725–4738, https://doi.org/10.5194/acp-11-4725-2011, 2011. a
Connolly, P. J., Möhler, O., Field, P. R., Saathoff, H., Burgess, R., Choularton, T., and Gallagher, M.: Studies of heterogeneous freezing by three different desert dust samples, Atmos. Chem. Phys., 9, 2805–2824, https://doi.org/10.5194/acp-9-2805-2009, 2009. a
Coufal, H. and Hefferle, P.: Thermal diffusivity measurements of thin films with a pyroelectric calorimeter, Appl. Phys. A, 38, 213–219, https://doi.org/10.1007/BF00616499, 1985. a
Debenedetti, P. G.: Metastable Liquids: Concepts and Principles, Princeton University Press, 1996. a
DeMott, P. J. and Rogers, D. C.: Freezing Nucleation Rates of Dilute Solution Droplets Measured between −30C and −40C in Laboratory Simulations of Natural Clouds, J. Atmos. Sci., 47, 1056–1064, 1990. a
DeMott, P. J., Möhler, O., Cziczo, D. J., Hiranuma, N., Petters, M. D., Petters, S. S., Belosi, F., Bingemer, H. G., Brooks, S. D., Budke, C., Burkert-Kohn, M., Collier, K. N., Danielczok, A., Eppers, O., Felgitsch, L., Garimella, S., Grothe, H., Herenz, P., Hill, T. C. J., Höhler, K., Kanji, Z. A., Kiselev, A., Koop, T., Kristensen, T. B., Krüger, K., Kulkarni, G., Levin, E. J. T., Murray, B. J., Nicosia, A., O'Sullivan, D., Peckhaus, A., Polen, M. J., Price, H. C., Reicher, N., Rothenberg, D. A., Rudich, Y., Santachiara, G., Schiebel, T., Schrod, J., Seifried, T. M., Stratmann, F., Sullivan, R. C., Suski, K. J., Szakáll, M., Taylor, H. P., Ullrich, R., Vergara-Temprado, J., Wagner, R., Whale, T. F., Weber, D., Welti, A., Wilson, T. W., Wolf, M. J., and Zenker, J.: The Fifth International Workshop on Ice Nucleation phase 2 (FIN-02): laboratory intercomparison of ice nucleation measurements, Atmos. Meas. Tech., 11, 6231–6257, https://doi.org/10.5194/amt-11-6231-2018, 2018. a
English, N. J. and Tse, J. S.: Massively parallel molecular dynamics simulation of formation of ice-crystallite precursors in supercooled water: Incipient-nucleation behavior and role of system size, Phys. Rev. E, 92, 32132, https://doi.org/10.1103/PhysRevE.92.032132, 2015. a
Etzel, K. D., Bickel, K. R., and Schuster, R.: A microcalorimeter for measuring heat effects of electrochemical reactions with submonolayer conversions, Rev. Sci. Instrum., 81, 034101, https://doi.org/10.1063/1.3309785, 2010. a
Frittmann, S., Halka, V., Jaramillo, C., and Schuster, R.: An improved sensor for electrochemical microcalorimetry, based on lithiumtantalate, Rev. Sci. Instrum., 86, 064102, https://doi.org/10.1063/1.4922859, 2015. a
Gibbs, A., Charman, M., Schwarzacher, W., and Rust, A. C.: Immersion freezing of supercooled water drops containing glassy volcanic ash particles, Geo Res. J., 7, 66–69, https://doi.org/10.1016/j.grj.2015.06.002, 2015. a, b
Harrison, A. D., Whale, T. F., Carpenter, M. A., Holden, M. A., Neve, L., O'Sullivan, D., Vergara Temprado, J., and Murray, B. J.: Not all feldspars are equal: a survey of ice nucleating properties across the feldspar group of minerals, Atmos. Chem. Phys., 16, 10927–10940, https://doi.org/10.5194/acp-16-10927-2016, 2016. a, b
Harrison, A. D., Whale, T. F., Rutledge, R., Lamb, S., Tarn, M. D., Porter, G. C. E., Adams, M. P., McQuaid, J. B., Morris, G. J., and Murray, B. J.: An instrument for quantifying heterogeneous ice nucleation in multiwell plates using infrared emissions to detect freezing, Atmos. Meas. Tech., 11, 5629–5641, https://doi.org/10.5194/amt-11-5629-2018, 2018. a, b
Häusler, T., Witek, L., Felgitsch, L., Hitzenberger, R., and Grothe, H.: Freezing on a Chip-A new approach to determine heterogeneous ice nucleation of micrometer-sized water droplets, Atmosphere, 9, 140, https://doi.org/10.3390/atmos9040140, 2018. a
Heneghan, A. F. and Haymet, A. D. J.: Liquid-to-crystal heterogeneous nucleation: bubble accelerated nucleation of pure supercooled water, Chem. Phys. Lett., 368, 177–182, 2003. a
Hiranuma, N., Augustin-Bauditz, S., Bingemer, H., Budke, C., Curtius, J., Danielczok, A., Diehl, K., Dreischmeier, K., Ebert, M., Frank, F., Hoffmann, N., Kandler, K., Kiselev, A., Koop, T., Leisner, T., Möhler, O., Nillius, B., Peckhaus, A., Rose, D., Weinbruch, S., Wex, H., Boose, Y., DeMott, P. J., Hader, J. D., Hill, T. C. J., Kanji, Z. A., Kulkarni, G., Levin, E. J. T., McCluskey, C. S., Murakami, M., Murray, B. J., Niedermeier, D., Petters, M. D., O'Sullivan, D., Saito, A., Schill, G. P., Tajiri, T., Tolbert, M. A., Welti, A., Whale, T. F., Wright, T. P., and Yamashita, K.: A comprehensive laboratory study on the immersion freezing behavior of illite NX particles: a comparison of 17 ice nucleation measurement techniques, Atmos. Chem. Phys., 15, 2489–2518, https://doi.org/10.5194/acp-15-2489-2015, 2015. a, b, c
Holden, M. A., Whale, T. F., Tarn, M. D., O'sullivan, D., Walshaw, R. D., Murray, B. J., Meldrum, F. C., and Christenson, H. K.: High-speed imaging of ice nucleation in water proves the existence of active sites, Sci. Adv., 5, eeav4316, https://doi.org/10.1126/sciadv.aav4316, 2019. a, b
Hoose, C. and Möhler, O.: Heterogeneous ice nucleation on atmospheric aerosols: a review of results from laboratory experiments, Atmos. Chem. Phys., 12, 9817–9854, https://doi.org/10.5194/acp-12-9817-2012, 2012. a
Jing, F., Yixin, L., Pengjv, M., Yongkun, G., Shichao, G., Bing, C., Junkun, T., and Yudong, L.: Supercooling and heterogeneous nucleation in acoustically levitated deionized water and graphene oxide nanofluids droplets, Exp. Therm. Fluid Sci., 103, 143–148, https://doi.org/10.1016/j.expthermflusci.2019.01.016, 2019. a
Kanji, Z. A. and Abbatt, J. P. D.: The University of Toronto Continuous Flow Diffusion Chamber (UT-CFDC): A Simple Design for Ice Nucleation Studies, Aerosol Sci Technol., 43, 730–738, https://doi.org/10.1080/02786820902889861, 2009. a
Kaufmann, L., Marcolli, C., Luo, B., and Peter, T.: Refreeze experiments with water droplets containing different types of ice nuclei interpreted by classical nucleation theory, Atmos. Chem. Phys., 17, 3525–3552, https://doi.org/10.5194/acp-17-3525-2017, 2017. a
Kiselev, A., Bachmann, F., Pedevilla, P., Cox, S. J., Michaelides, A., Gerthsen, D., and Leisner, T.: Active sites in heterogeneous ice nucleation-the example of K-rich feldspars, Science, 355, 367–371, 2017. a, b
Knopf, D. A., Alpert, P. A., Zipori, A., Reicher, N., and Rudich, Y.: Stochastic nucleation processes and substrate abundance explain time-dependent freezing in supercooled droplets, npj Climate and Atmospheric Science, 3, 2, https://doi.org/10.1038/s41612-020-0106-4, 2020. a
Koop, T., Luo, B., Biermann, U. M., Crutzen, P. J., and Peter, T.: Freezing of Solutions at Stratospheric Temperatures: Nucleation Statistics and Experiments, J. Phys. Chem. A, 101, 1117–1133, https://doi.org/10.1021/jp9626531, 1997. a
Krämer, B., Hübner, O., Vortisch, H., Wöste, L., Leisner, T., Schwell, M., Rühl, E., and Baumgärtel, H.: Homogeneous nucleation rates of supercooled water measured in single levitated microdroplets, J. Chem. Phys., 111, 6521–6527, https://doi.org/10.1063/1.479946, 1999. a
Kubota, N.: Random distribution active site model for ice nucleation in water droplets, Cryst. Eng. Comm., 21, 3810–3821, https://doi.org/10.1039/c9ce00246d, 2019. a
Kumar, A., Marcolli, C., Luo, B., and Peter, T.: Ice nucleation activity of silicates and aluminosilicates in pure water and aqueous solutions – Part 1: The K-feldspar microcline, Atmos. Chem. Phys., 18, 7057–7079, https://doi.org/10.5194/acp-18-7057-2018, 2018. a, b, c, d
Kunert, A. T., Lamneck, M., Helleis, F., Pöschl, U., Pöhlker, M. L., and Fröhlich-Nowoisky, J.: Twin-plate Ice Nucleation Assay (TINA) with infrared detection for high-throughput droplet freezing experiments with biological ice nuclei in laboratory and field samples, Atmos. Meas. Tech., 11, 6327–6337, https://doi.org/10.5194/amt-11-6327-2018, 2018. a, b
Lang, S. B. and Das-Gupta, D. K.: A New Technique for Determination of the Spatial Distribution of Polarization in Polymer Electrets, Ferroelectrics, 60, 23–36, https://doi.org/10.1080/00150198408017506?needAccess=true, 1984. a
Lee, M. R. and Parsons, I.: Microtextural controls of weathering of perthitic alkali feldspars, Geochim. Cosmochim. Ac., 4465–4488, https://doi.org/10.1016/0016-7037(95)00255-X, 1995. a
Lew, W., Lytken, O., Farmer, J. A., Crowe, M. C., and Campbell, C. T.: Improved pyroelectric detectors for single crystal adsorption calorimetry from 100 to 350 K, Rev. Sci. Instrum., 81, 024102, https://doi.org/10.1063/1.3290632, 2010. a
Lü, Y. J. and Wei, B.: Supercooling of aqueous NaCl and KCl solutions under acoustic levitation, J. Chem. Phys., 125, 144503, https://doi.org/10.1063/1.2358134, 2006. a
Macedonio, G., Costa, A., and Folch, A.: Uncertainties in volcanic plume modeling: A parametric study using FPLUME, J. Volcanol. Geoth. Res., 326, 92–102, https://doi.org/10.1016/j.jvolgeores.2016.03.016, 2016. a
Marcolli, C.: Deposition nucleation viewed as homogeneous or immersion freezing in pores and cavities, Atmos. Chem. Phys., 14, 2071–2104, https://doi.org/10.5194/acp-14-2071-2014, 2014. a
Maters, E. C., Dingwell, D. B., Cimarelli, C., Müller, D., Whale, T. F., and Murray, B. J.: The importance of crystalline phases in ice nucleation by volcanic ash, Atmos. Chem. Phys., 19, 5451–5465, https://doi.org/10.5194/acp-19-5451-2019, 2019. a
Möhler, O., Stetzer, O., Schaefers, S., Linke, C., Schnaiter, M., Tiede, R., Saathoff, H., Krämer, M., Mangold, A., Budz, P., Zink, P., Schreiner, J., Mauersberger, K., Haag, W., Kärcher, B., and Schurath, U.: Experimental investigation of homogeneous freezing of sulphuric acid particles in the aerosol chamber AIDA, Atmos. Chem. Phys., 3, 211–223, https://doi.org/10.5194/acp-3-211-2003, 2003. a
Murray, B. J., O'sullivan, D., Atkinson, J. D., and Webb, M. E.: Ice nucleation by particles immersed in supercooled cloud droplets, Chem. Soc. Rev., 41, 6519–6554, https://doi.org/10.1039/c2cs35200a, 2012. a
Parody-Morreale, A., Bishop, G., Fall, R., and Gill, S. J.: A differential scanning calorimeter for ice nucleation distribution studies-Application to bacterial nucleators, Anal. Biochem., 154, 682–690, https://doi.org/10.1016/0003-2697(86)90047-3, 1986. a
Peckhaus, A., Kiselev, A., Hiron, T., Ebert, M., and Leisner, T.: A comparative study of K-rich and Na/Ca-rich feldspar ice-nucleating particles in a nanoliter droplet freezing assay, Atmos. Chem. Phys., 16, 11477–11496, https://doi.org/10.5194/acp-16-11477-2016, 2016. a, b, c, d, e
Pedevilla, P., Cox, S. J., Slater, B., and Michaelides, A.: Can Ice-Like Structures Form on Non-Ice-Like Substrates? The Example of the K-feldspar Microcline, J. Phys. Chem. C, 120, 6704–6713, https://doi.org/10.1021/acs.jpcc.6b01155, 2016. a, b
Polen, M., Brubaker, T., Somers, J., and Sullivan, R. C.: Cleaning up our water: reducing interferences from nonhomogeneous freezing of “pure” water in droplet freezing assays of ice-nucleating particles, Atmos. Meas. Tech., 11, 5315–5334, https://doi.org/10.5194/amt-11-5315-2018, 2018. a
Pruppacher, H. R. and Klett, J. D.: Microphysics of Clouds and Precipitation, Kluwer Academic Publishers, 2 edn., https://doi.org/10.1007/978-0-306-48100-0, 1997. a
Reicher, N., Segev, L., and Rudich, Y.: The WeIzmann Supercooled Droplets Observation on a Microarray (WISDOM) and application for ambient dust, Atmos. Meas. Tech., 11, 233–248, https://doi.org/10.5194/amt-11-233-2018, 2018. a
Riechers, B., Wittbracht, F., Hütten, A., and Koop, T.: The homogeneous ice nucleation rate of water droplets produced in a microfluidic device and the role of temperature uncertainty, Phys. Chem. Chem. Phys., 15, 5873–5887, https://doi.org/10.1039/c3cp42437e, 2013. a
Rogers, D. C.: Development of a Continuous Flow Thermal Gradient Diffusion Chamber for Ice Nucleation Studies, Atmos. Res., 22, 149–181, 1988. a
Soni, A. and Patey, G. N.: Simulations of water structure and the possibility of ice nucleation on selected crystal planes of K-feldspar, J. Chem. Phys., 150, 214501, https://doi.org/10.1063/1.5094645, 2019. a
Sosso, G. C., Chen, J., Cox, S. J., Fitzner, M., Pedevilla, P., Zen, A., and Michaelides, A.: Crystal Nucleation in Liquids: Open Questions and Future Challenges in Molecular Dynamics Simulations, Chem. Rev., 116, 7078–7116, https://doi.org/10.1021/acs.chemrev.5b00744, 2016. a
Stetzer, O., Baschek, B., Lüönd, F., and Lohmann, U.: The Zurich Ice Nucleation Chamber (ZINC)-A New Instrument to Investigate Atmospheric Ice Formation, Aerosol Sci. Technol., 42, 64–74, https://doi.org/10.1080/02786820701787944, 2008. a
Stopelli, E., Conen, F., Zimmermann, L., Alewell, C., and Morris, C. E.: Freezing nucleation apparatus puts new slant on study of biological ice nucleators in precipitation, Atmos. Meas. Tech., 7, 129–134, https://doi.org/10.5194/amt-7-129-2014, 2014. a
Tarn, M. D., Sikora, S. N. F., Porter, G. C. E., O 'sullivan, D., Adams, M., Whale, T. F., Harrison, A. D., Vergara-Temprado, J., Wilson, T. W., Shim, J., and Murray, B. J.: The study of atmospheric ice-nucleating particles via microfluidically generated droplets, Microfluidic. Nanofluid., 22, 52, https://doi.org/10.1007/s10404-018-2069-x, 2018. a, b, c
Tobo, Y.: An improved approach for measuring immersion freezing in large droplets over a wide temperature range, Sci. Rep.-UK, 6, 32930, https://doi.org/10.1038/srep32930, 2016. a, b, c
Tobo, Y., Prenni, A. J., Demott, P. J., Huffman, J. A., McCluskey, C. S., Tian, G., Pöhlker, C., Pöschl, U., and Kreidenweis, S. M.: Biological aerosol particles as a key determinant of ice nuclei populations in a forest ecosystem, J. Geophys. Res.-Atmos., 118, 10100–10110, https://doi.org/10.1002/jgrd.50801, 2013. a
Vali, G.: Interpretation of freezing nucleation experiments: singular and stochastic; sites and surfaces, Atmos. Chem. Phys., 14, 5271–5294, https://doi.org/10.5194/acp-14-5271-2014, 2014. a
Whale, T. F., Murray, B. J., O'Sullivan, D., Wilson, T. W., Umo, N. S., Baustian, K. J., Atkinson, J. D., Workneh, D. A., and Morris, G. J.: A technique for quantifying heterogeneous ice nucleation in microlitre supercooled water droplets, Atmos. Meas. Tech., 8, 2437–2447, https://doi.org/10.5194/amt-8-2437-2015, 2015. a, b, c
Whale, T. F., Holden, M. A., Kulak, A. N., Kim, Y., Meldrum, F. C., Christenson, H. K., and Murray, B. J.: The role of phase separation and related topography in the exceptional ice-nucleating ability of alkali feldspars, Phys. Chem. Chem. Phys., 19, 31186–31193, https://doi.org/10.1039/c7cp04898j, 2017. a, b, c
Whatmore, R. W.: Pyroelectric Devices and Materials, Rep. Prog. Phys., 49, 1335–1386, https://doi.org/10.1088/0034-4885/49/12/002, 1986. a
Wright, H. M. N., Cashman, K. V., Mothes, P. A., Hall, M. L., Ruiz, A. G., and Le Pennec, J.-L.: Estimating rates of decompression from textures of erupted ash particles produced by 1999–2006 eruptions of Tungurahua volcano, Ecuador, Geology, 40, 619–622, https://doi.org/10.1130/G32948.1, 2012. a
Yakobi-Hancock, J. D., Ladino, L. A., and Abbatt, J. P. D.: Feldspar minerals as efficient deposition ice nuclei, Atmos. Chem. Phys., 13, 11175–11185, https://doi.org/10.5194/acp-13-11175-2013, 2013. a
Yao, Y., Ruckdeschel, P., Graf, R., Butt, H.-J., Retsch, M., and Floudas, G.: Homogeneous Nucleation of Ice Confined in Hollow Silica Spheres, J. Phys. Chem. B, 121, 306–313, https://doi.org/10.1021/acs.jpcb.6b11053, 2017. a
Zaragotas, D., Liolios, N. T., and Anastassopoulos, E.: Supercooling, ice nucleation and crystal growth: a systematic study in plant samples, Cryobiology, 72, 239–243, https://doi.org/10.1016/j.cryobiol.2016.03.012, 2016. a
Zolles, T., Burkart, J., Ha, T., Pummer, B., Hitzenberger, R., and Grothe, H.: Identification of Ice Nucleation Active Sites on Feldspar Dust Particles, J. Phys. Chem. A, 119, 2692–2700, https://doi.org/10.1021/jp509839x, 2015. a